Next Lesson - Pulmonary Embolism
Abstract
- Lung function can be assessed non-invasively through spirometry
- Vital capacity is the maximum expiratory volume after a full inspiration, and can be predicted based on sex, height and age of the patient. A reduced vital capacity indicates a restrictive lung disease, whilst an obstructive lung disease will have a near normal vital capacity.
- Time-volume graph plots volume of expired air against time.
- Obstructive lung disease will have a FEV1/FVC ratio of < 70%, whilst restrictive lung disease will have a FEV1/FVC ratio > 70%.
- Flow-volume curves plot airflow against lung volume and diagrammatically show
- Patients with an obstructive lung disease will create scalloping on their flow-volume curve with an early fall in the airflow rate in expiration, whilst patients with restrictive lung disease will have a reduced vital capacity (width) on their flow-volume curve.
- A patient’s peak expiratory flow rate quickly by using a peak flow meter; the value can be plotted on graph in comparison with predicted values depending on their sex and height.
- There are number of special lung tests: helium dilution test for measuring patient’s residual volume, nitrogen washout for assessing patient’s anatomical dead space and the carbon monoxide transfer factor to assess patient’s resistance to diffusion across the alveolar membrane.
Core
Lung function can be assessed non-invasively through spirometry. These tests are useful in the diagnosis and management of diseases of the respiratory system.
On the spirometry tracing, the tidal volume (VT) is the volume of air that enters and leaves the lungs in each normal breath, and is unconscious and requires no effort. The inhalation in tidal volume can therefore be called quiet inspiration, and the exhalation called quiet expiration.
If a patient takes a deep breath in, the amount of air contained in the lungs becomes much larger than the tidal volume, and this is known as inspiratory reserve volume (IRV). It can be performed clinically by asking the patient to breathe in normally (as for tidal volume), but then take a very big breath in. This action is called forceful inspiration, because the patient has to consciously move air into the lungs.
If the patient then breathes out more than normal, this is called expiratory respiratory volume (ERV). It is worked out by the patient performing a normal breath out (as for tidal volume), but then breathing out all of the possible air in the lungs. This action is called forceful expiration, because the patient has to consciously move air out of the lungs.
After the forced expiration, the lungs are not completely emptied. This is because if every last bit of air was breathed out from the lungs, all the bronchi would collapse, meaning that no air could be inhaled again. This is described as the residual volume (RV).
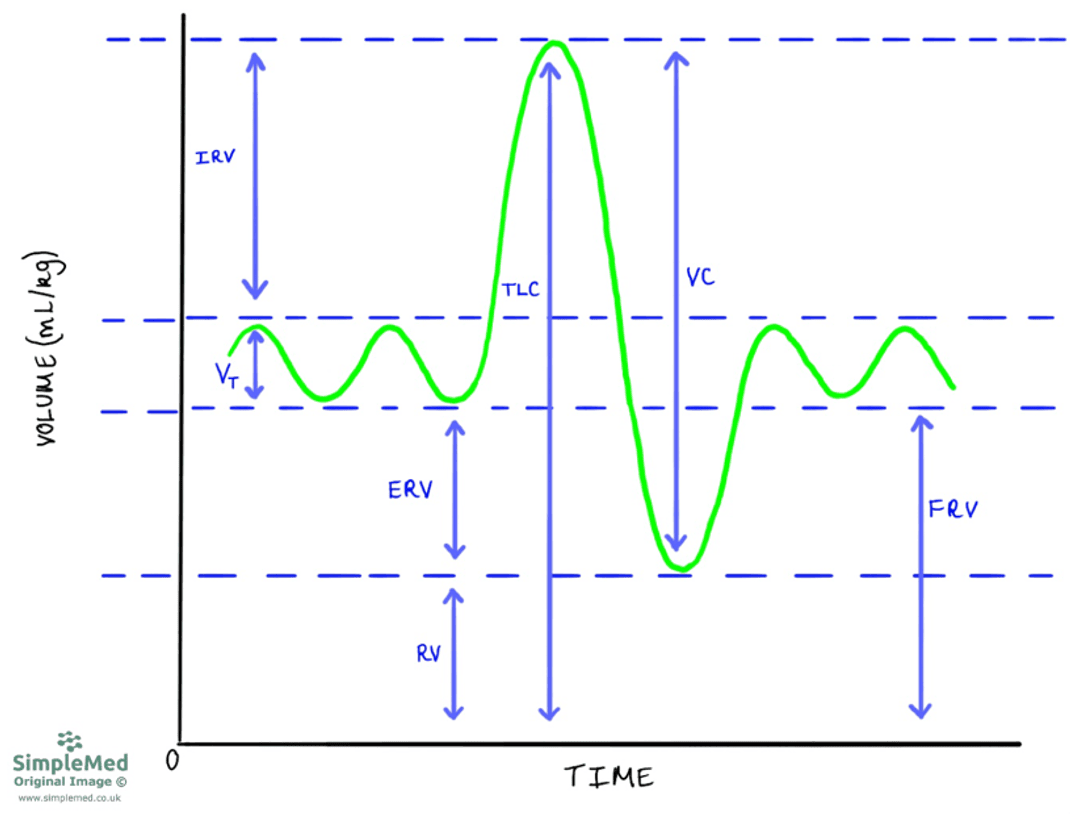
Diagram - Spirometry tracing with labels for the various measurements that can be made
SimpleMed original by Peter Parkinson
The capacity of the lungs is a fixed amount, it is the entire volume of air that is able to fit in the lungs. It is not dependent on any ventilation, so two patients can have the same lung capacity (the same maximum volume of air), but different values for ventilations like tidal volume (see above).
The inspiratory capacity is defined from the end of quiet expiration to the maximum inspiration, and this can be calculated by the addition of inspiratory reserve volume and tidal volume.
The functional residual capacity (FRV) is defined as the volume of air in the lungs at the end of quiet expiration and this can be calculated by the addition of expiratory reserve volume and residual volume.
Vital capacity (VC) is defined as the maximal volume of air that can be expelled from a patient’s lung after maximal inspiration. It is the maximum amount of air that a patient is capable of moving into or out of their lungs. This can be calculated through a number of methods:
- Inspiratory capacity plus expiratory reserve volume.
- Inspiratory reserve volume plus tidal volume plus expiratory reserve volume.
- Total lung volume minus residual volume.
The Total Lung Volume or Total Lung Capacity (TLC) are defined as the total volume of air present in the lungs after maximal inspiration. This can be calculated by adding the vital capacity and residual volume
Vital capacity is one of the most important measurements of the lungs from a spirometry tracing. A patient’s vital capacity can be predicted based on sex, height and age, and any deviation from this predicted value can indicate pathology.
Vital capacity requires a patient to inhale maximally then exhale maximally. This means that any pathology of the lungs (e.g. stiffness in fibrosis), muscles of breathing (e.g. neuromuscular disorders) or of the chest wall (e.g. kyphoscoliosis) can affect the vital capacity. All of these conditions will present with a reduced vital capacity and will have the same pattern as a restrictive lung disease (even if the cause is outside the lungs) because the lungs cannot fill effectively.
Patients with an obstructive lung disease will have a near normal vital capacity because the lungs are able to fill to their full capacity. However, their expiratory flow will be compromised as the already pathologically narrowed airways will be further compressed during expiration. This increases flow resistance and produces an obstructive picture during spirometry testing.
To separate patients with restrictive lung disease from those with an obstructive lung disease, a patient can be asked to exhale rapidly after taking a maximal inspiration through a single breath spirometer. The result can then be plotted on a time-volume graph, with the volume expired plotted against the time in seconds.
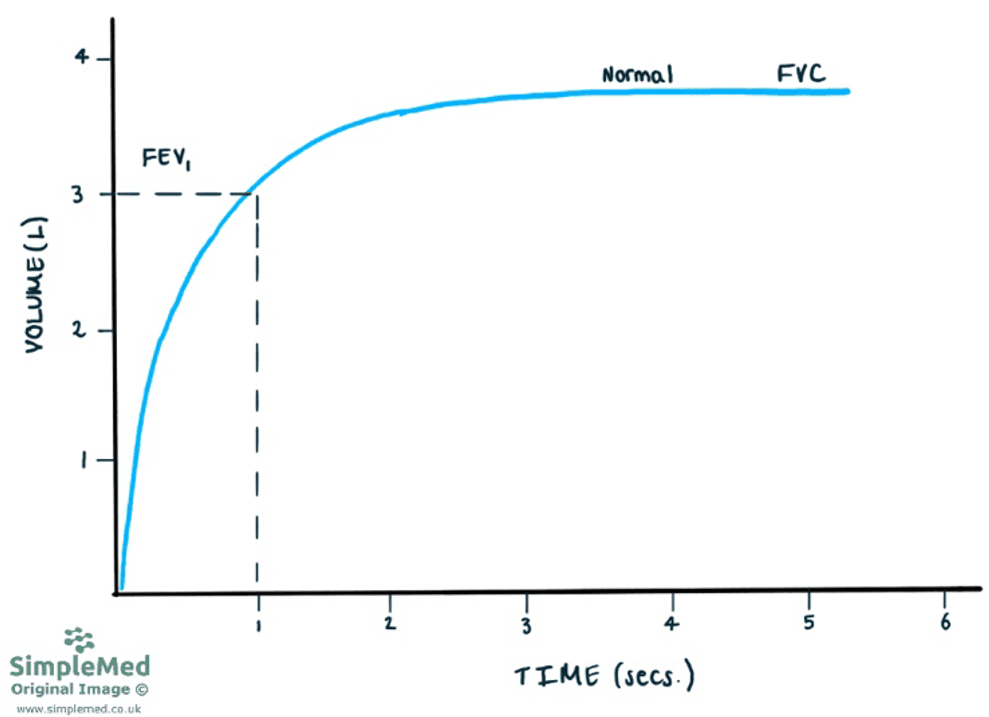
Diagram - Time-volume graph for a healthy individual
SimpleMed original by Peter Parkinson
To distinguish between restrictive and obstruction lung disease patients, measure the force expiratory volume in one second, known as FEV1.
In healthy individuals, the ratio between FEV1 and forced vital capacity (FVC) is greater than 70%.
In patients suffering from an obstructive lung diseases such as asthma and chronic obstructive pulmonary disease (COPD), their FVC will be near normal because obstructive lung disease does not affect the lung capacity. However, their FEV1 will be reduced significantly due to the obstructive lung pathology making it more difficult to empty the lungs at speed. This results in FEV1/FVC ratio being <70%.
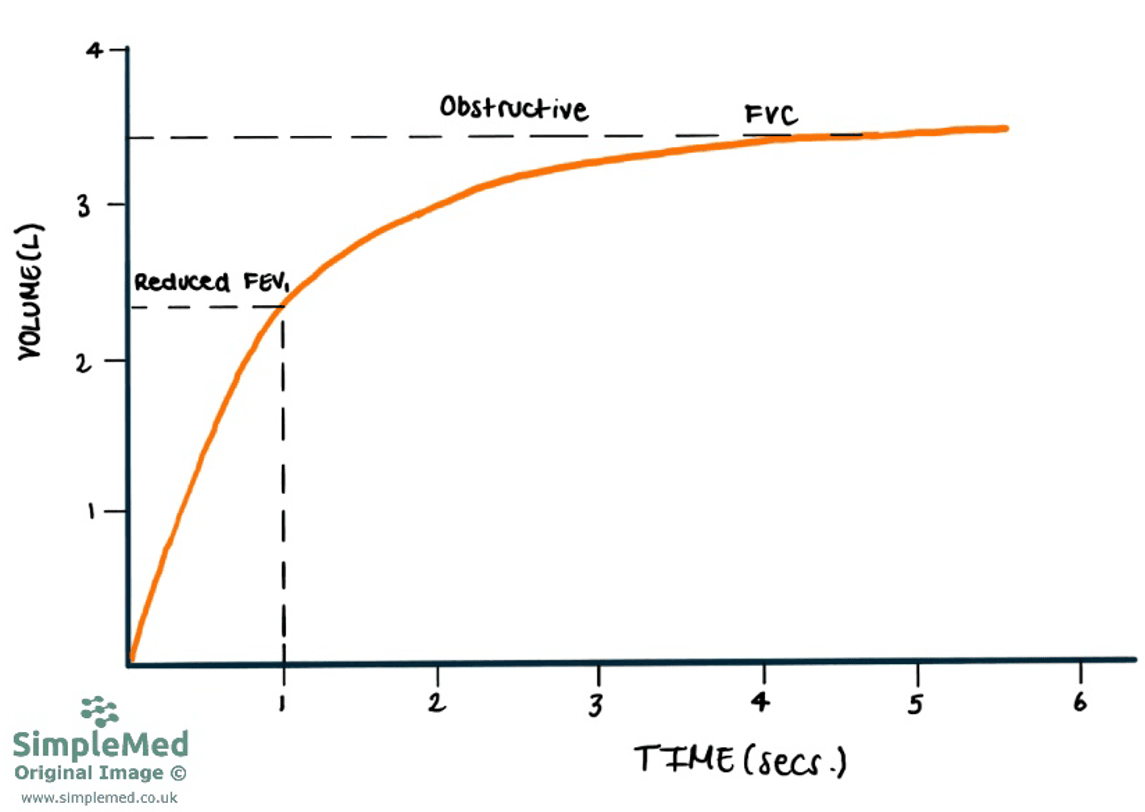
Diagram - Time-volume graph for a patient with an obstructive lung disease
SimpleMed original by Peter Parkinson
In patient suffering from a restrictive lung disease such as pulmonary fibrosis, their FVC will be reduced because the lungs cannot expand as effectively. Their FEV1 will also be reduced because their lungs cannot expand or contract very well, but this reduction is proportional to the reduction in FVC. This results in the FEV1/FVC ratio being >70%.
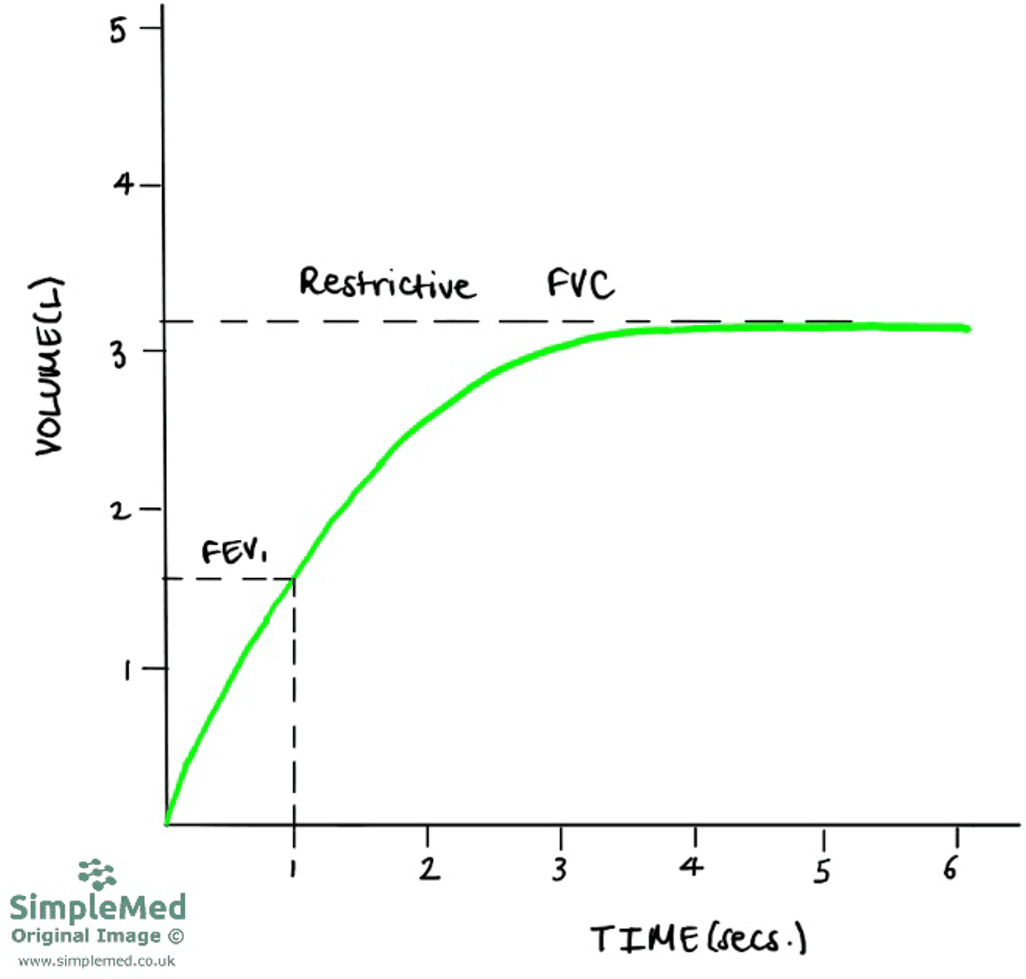
Diagram - Time-volume graph for a patient with a restrictive lung disease
SimpleMed original by Peter Parkinson
Flow volume curves plot airflow in litres per second against lung volume. It tracks the patient through full cycles of breaths, from complete exhalation through inhalation and back to exhalation again. They are useful in identifying obstructive lung diseases, as flow volume curves are more sensitive to changes from normal in comparison to time-volume graphs. They can also be used to assess whether airflow is appropriate for the patient’s lung volume.
For example, patients with a restrictive disease such as pulmonary fibrosis, will have a reduced lung volume and if measured alone (as in time-volume graph), their airflow will appear decreased. When airflow is measured in conjunction with lung volume (as in a flow-volume loop), their airflow is higher than normal.
When the lungs are expanded at the start of expiration, the airways are stretched fully open and the peak expiratory flow can be seen. During expiration, the radial traction (outward pull on the airways keeping them patent) decreases, and compress the small airways causing a decrease in the flow of air.
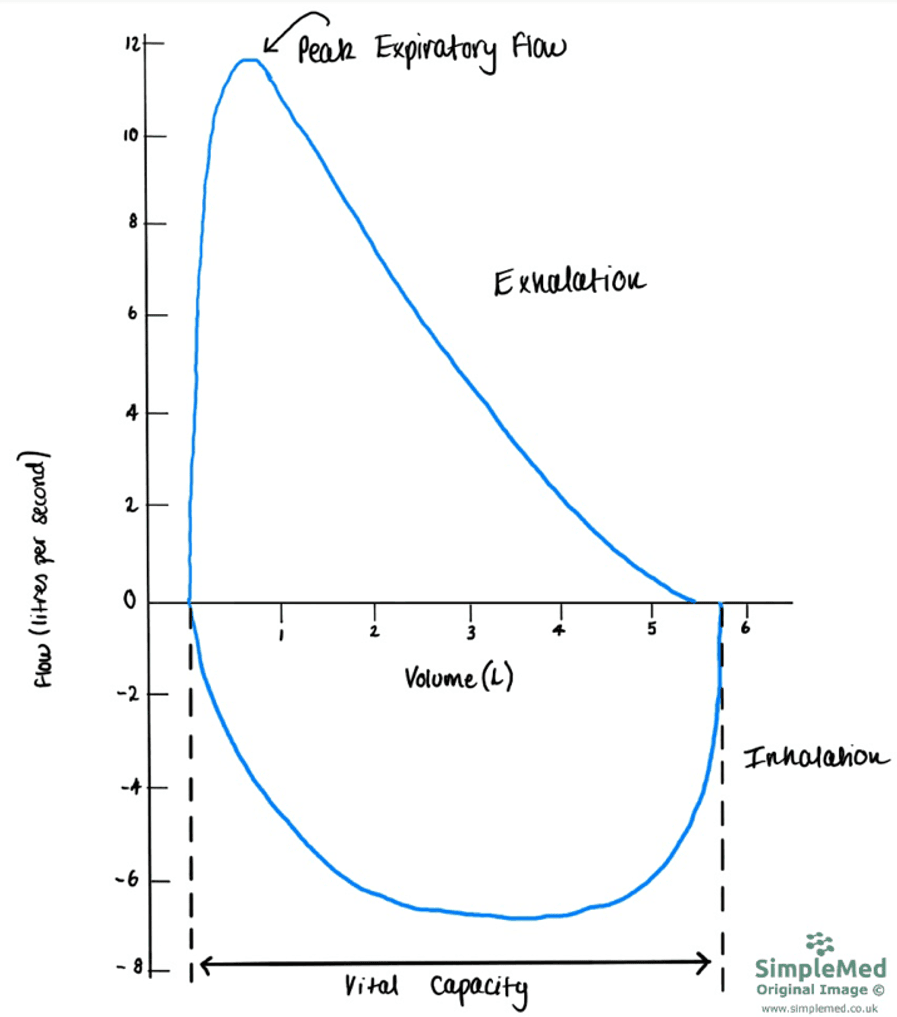
Diagram - Flow-volume curve for a healthy individual. Note how inhalation has a negative flow, and exhalation has a positive flow
SimpleMed original by Peter Parkinson
When there is an obstruction of the small airways, an early fall in the flow rate is seen. Mild obstruction of the small airways (as seen in asthma) will lead to scalloping on the flow-volume curve and in severe cases, a reduction in the peak expiratory flow rate is seen (reduction in height of the loop).
In patients with an obstructive lung disease, reversibility testing can be conducted. This involves in giving the patient an inhaled bronchodilator to assess how responsive the patient’s airway is to the medication. Patients with asthma commonly a better response to the medication compared to patient’s with COPD.
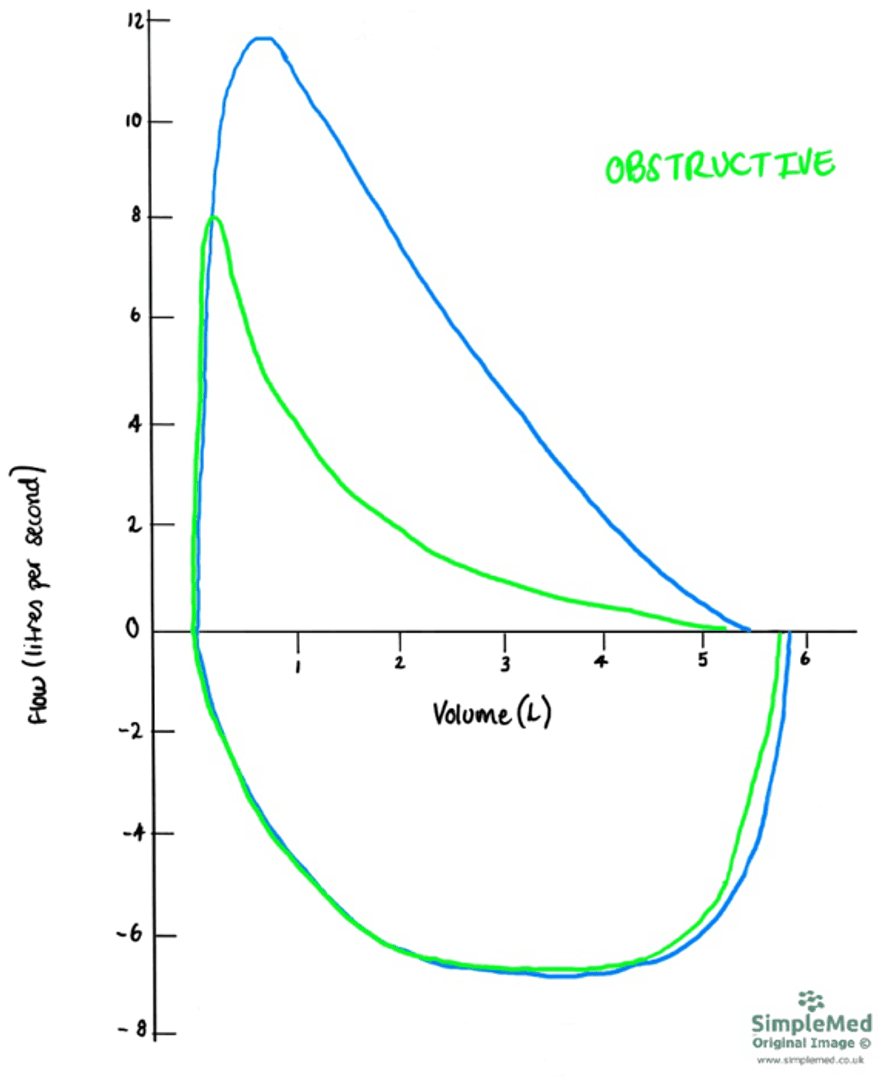
Diagram - The differences in the flow volume curve of a healthy individual (blue) vs a patient with obstructive lung disease (green)
SimpleMed original by Peter Parkinson
In patients with restrictive lung disease, the flow volume curve will be narrower because the lungs struggle to fill completely. This leads to a lower vital capacity.
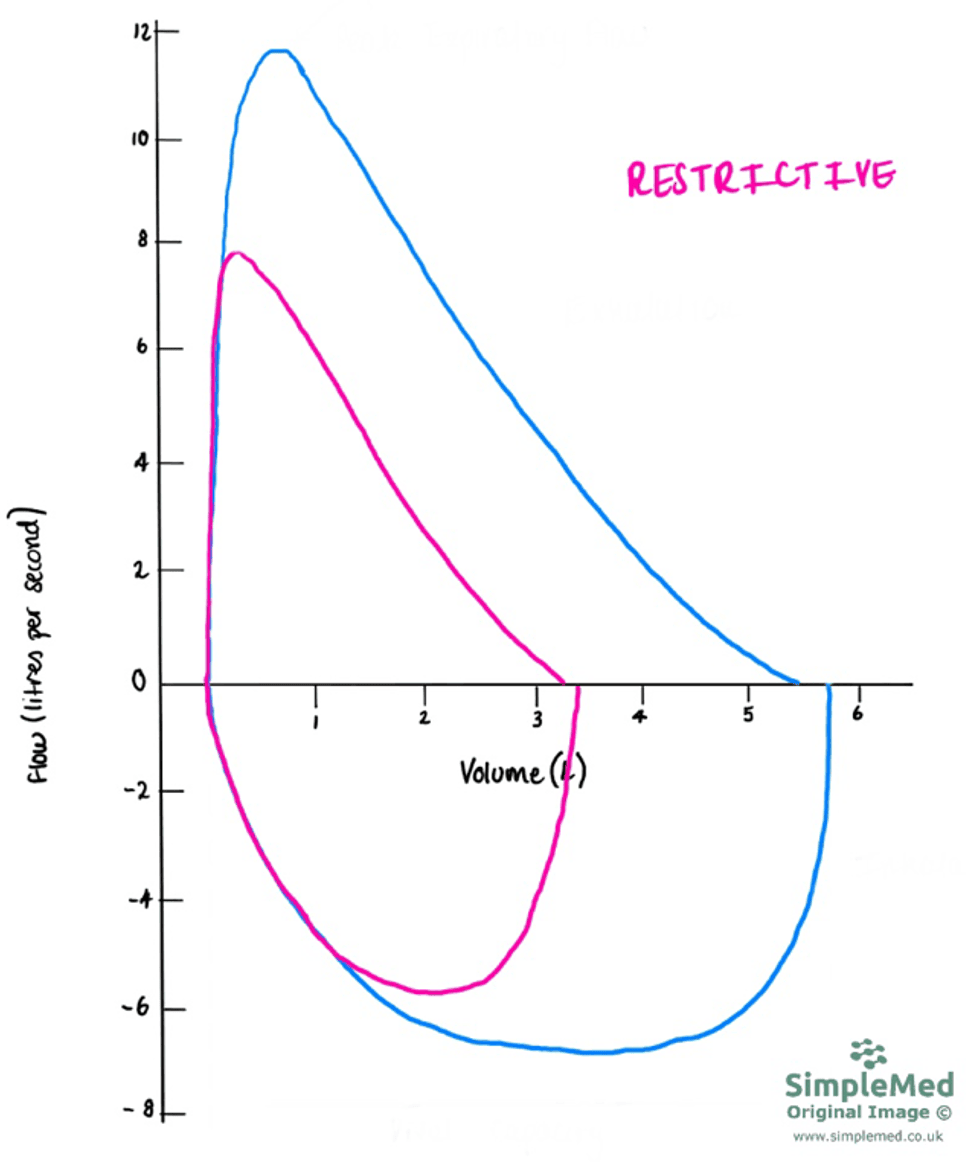
Diagram - Flow-volume curve for patient with a restrictive lung disease (pink) compared to a healthy patient (blue). Note the narrowed vital capacity in comparison to the normal flow-volume curve
SimpleMed original by Peter Parkinson
A patient’s peak expiratory flow rate (PEFR) can be measured in clinical practice with a cheap, simple device called a peak flow meter. Doctors in general practice can use these devices when suspecting a patient with an obstructive lung disease. Patients can also use these devices at home to monitor their condition. The patient’s PEFR value can be plotted on a graph to compare against their predicted value based on sex and height to assess the severity of the condition.
It is important that healthcare professionals properly educate patients in how to use the peak flow meters so that the readings are accurate. To get an accurate measurement of the PEFR, the patient needs to blow a short sharp breath into the mouthpiece of the peak flow meter. It is important for clinicians to emphasise that it is the speed of the air that is important, not the volume.
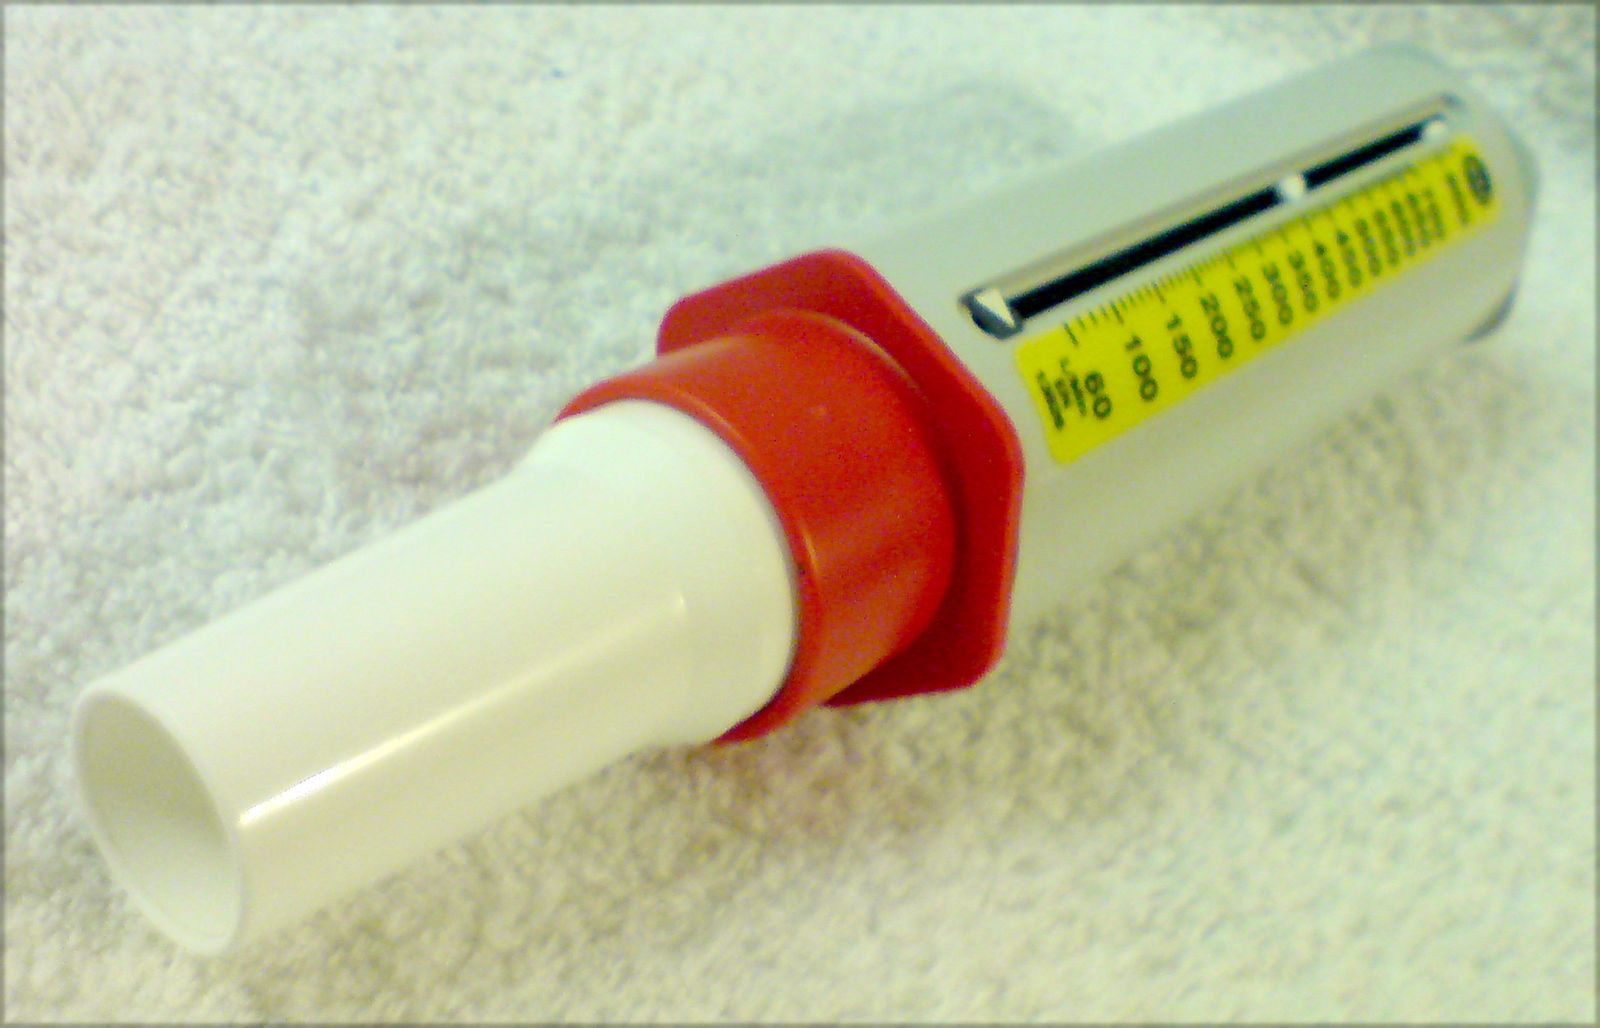
Image - Peak flow meter
Public Domain Source [Public domain]
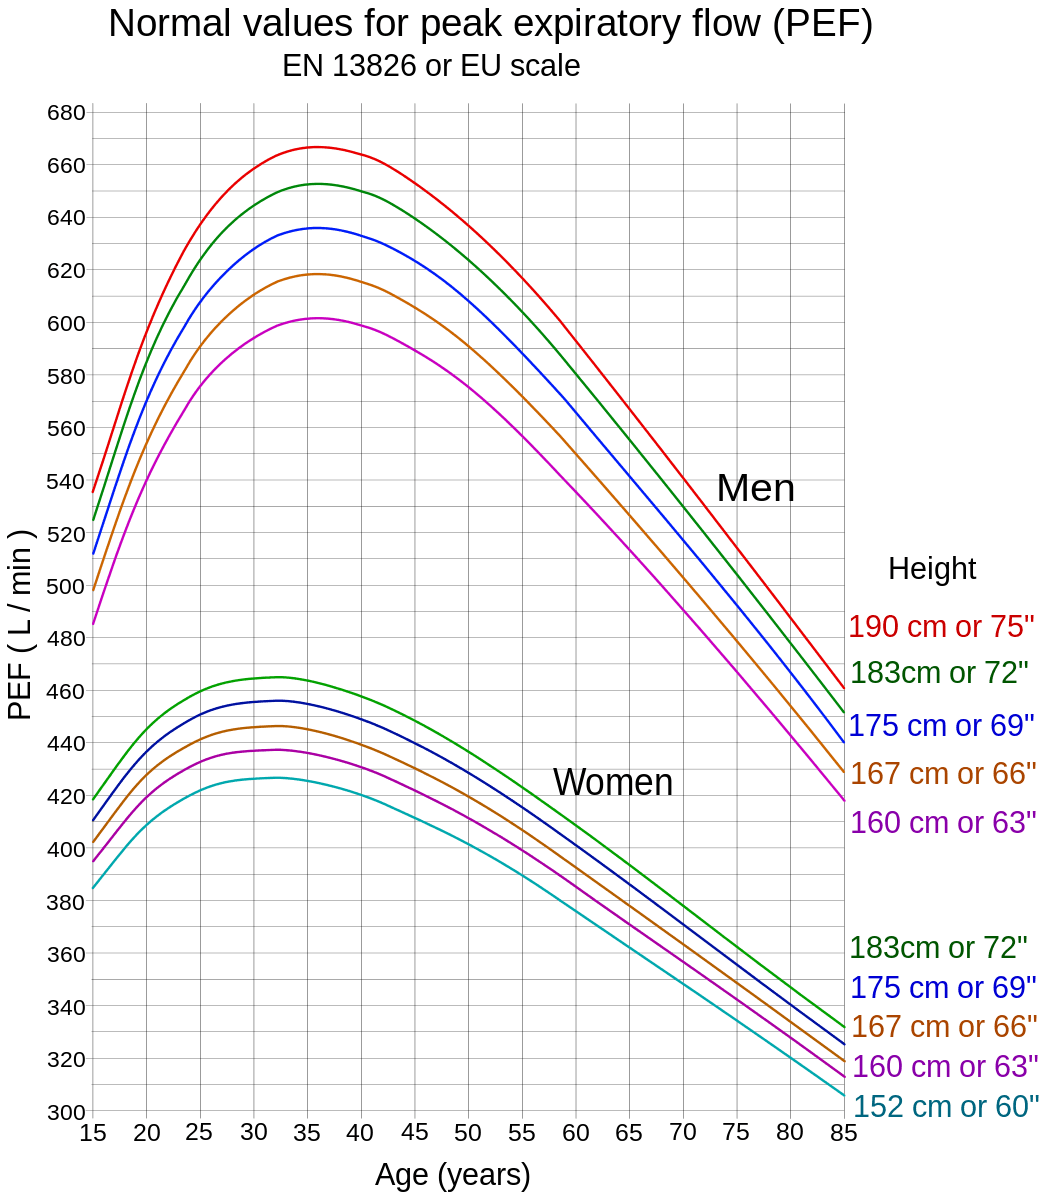
Image - Normal values for peak flow meter readings
Public Domain Source [Public domain]
The following tests are not performed routinely but can be useful when pathology is difficult to identify on other tests like spirometry.
A patient’s residual volume can be calculated using the helium dilution test. This test requires a closed-circuit system (meaning the patient’s mouth is secured to the mouthpiece of the device so no air can leak), and spirometer is filled with a mixture of oxygen and helium. There is a known a concentration and volume of helium present in the spirometer before the test begins. The patient breathes normally into the machine, and the amount of gas exchange that occurs is measured through the concentrations.
The helium dilution test is used for the assessment of restrictive lung diseases, and can be helpful if planning a surgical intervention for this disease.
A patient’s anatomical dead space can be measured using the nitrogen washout test. A patient is asked to breathe out as much as they can, then inhales 100% oxygen for a few minutes before exhaling through a one-way valve measuring nitrogen concentration. As nitrogen does not take part in gas exchange in the alveoli, nitrogen gas sits in the airways until it is exhaled. Initially, oxygen is breathed out as the patient has been breathing in 100% oxygen, but as the oxygen is absorbed, the nitrogen that was present in the anatomical dead space will start to be breathed out, and the concentration of nitrogen exhaled begins to rise. In a healthy person, it takes around 7 minutes for all the nitrogen from the anatomical dead space to be expelled. If there is narrowing of the airways, it may take longer for the nitrogen to be fully expelled. This means that this test is useful for diagnosing obstructive.
To assess a patient’s resistance to diffusion across the alveolar membrane, carbon monoxide transfer factor (TLCO) can be used. The assessment measures the overall lung’s ability to transfer gas. Carbon monoxide (CO) is used as it is taken up by haemoglobin in red blood cells, in the same way oxygen is, but it is not used up in the body like oxygen, meaning concentrations can be accurately measured (any CO in the blood was put there by the test). Patient inhales a test gas, which contains a fixed, small concentration of carbon monoxide, and then breathes it out into a sample bag. The difference in concentration of CO from the test gas breathed into the sample can be used as an estimate for the rate of diffusion of carbon monoxide.
The TLCO test is used monitor lung conditions such as pulmonary fibrosis and COPD (because these conditions affect the amount of oxygen absorbed) and can be used to assess how well a patient’s lungs will react to chemotherapy. An increased value (i.e. more diffusion) will be seen in conditions such as increased blood flow to the lungs, like obesity and asthma. A decreased value can be seen in pulmonary fibrosis, decreased total lung area, COPD and pulmonary embolism.
Edited by: Dr. Maddie Swannack
Reviewed by: Dr. Thomas Burnell
- 6417

